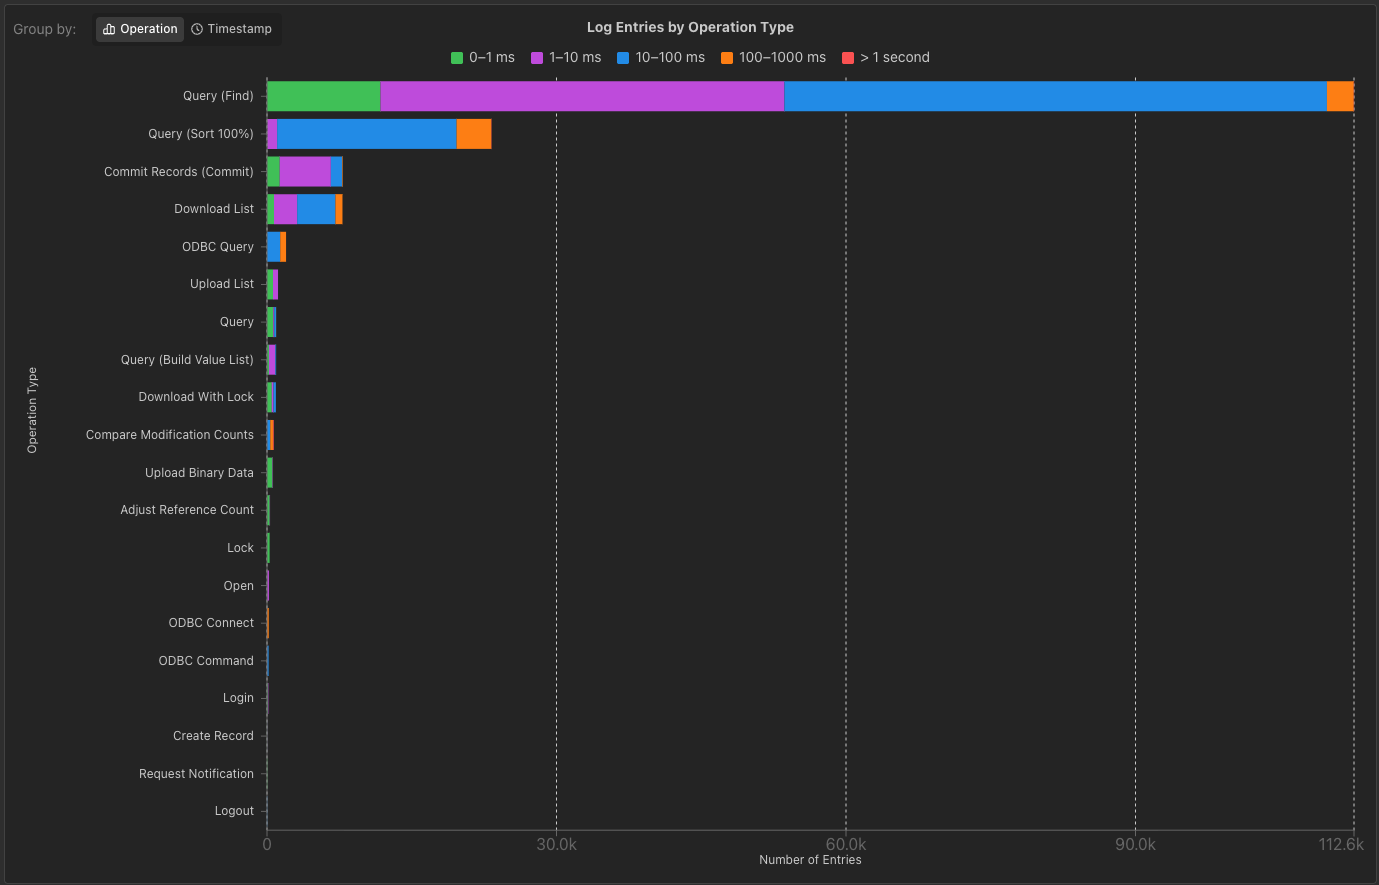
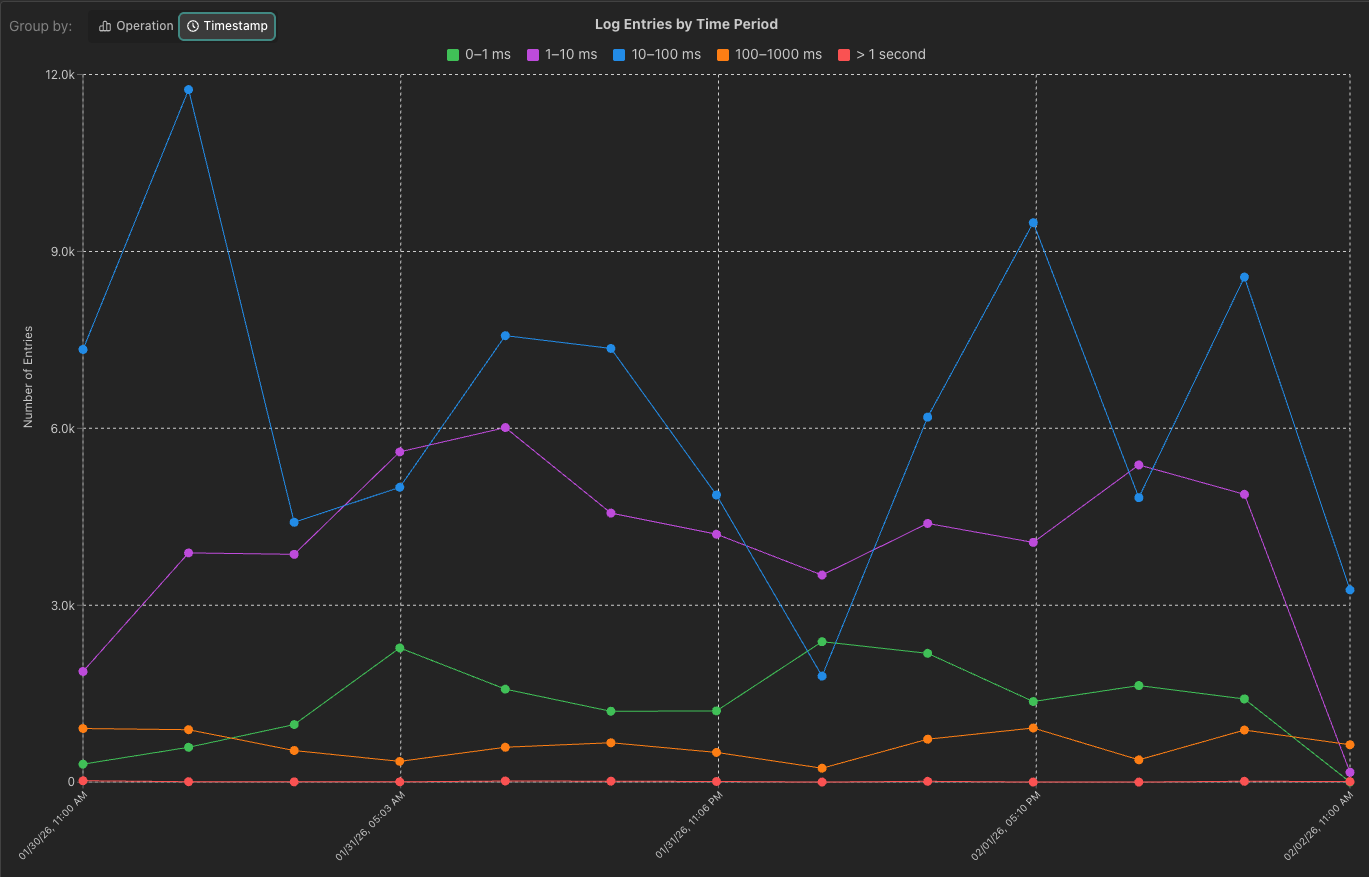
I’m excited to announce the Ottomatic Cloud Console’s newest developer tool, the TopCallStats analyzer! This tool lets you upload (or pull straight from a server) a TopCallStats.log file from FileMaker, which it will then parse and display for you. This lets you view highest load requests and see what periods of time have the slowest queries.
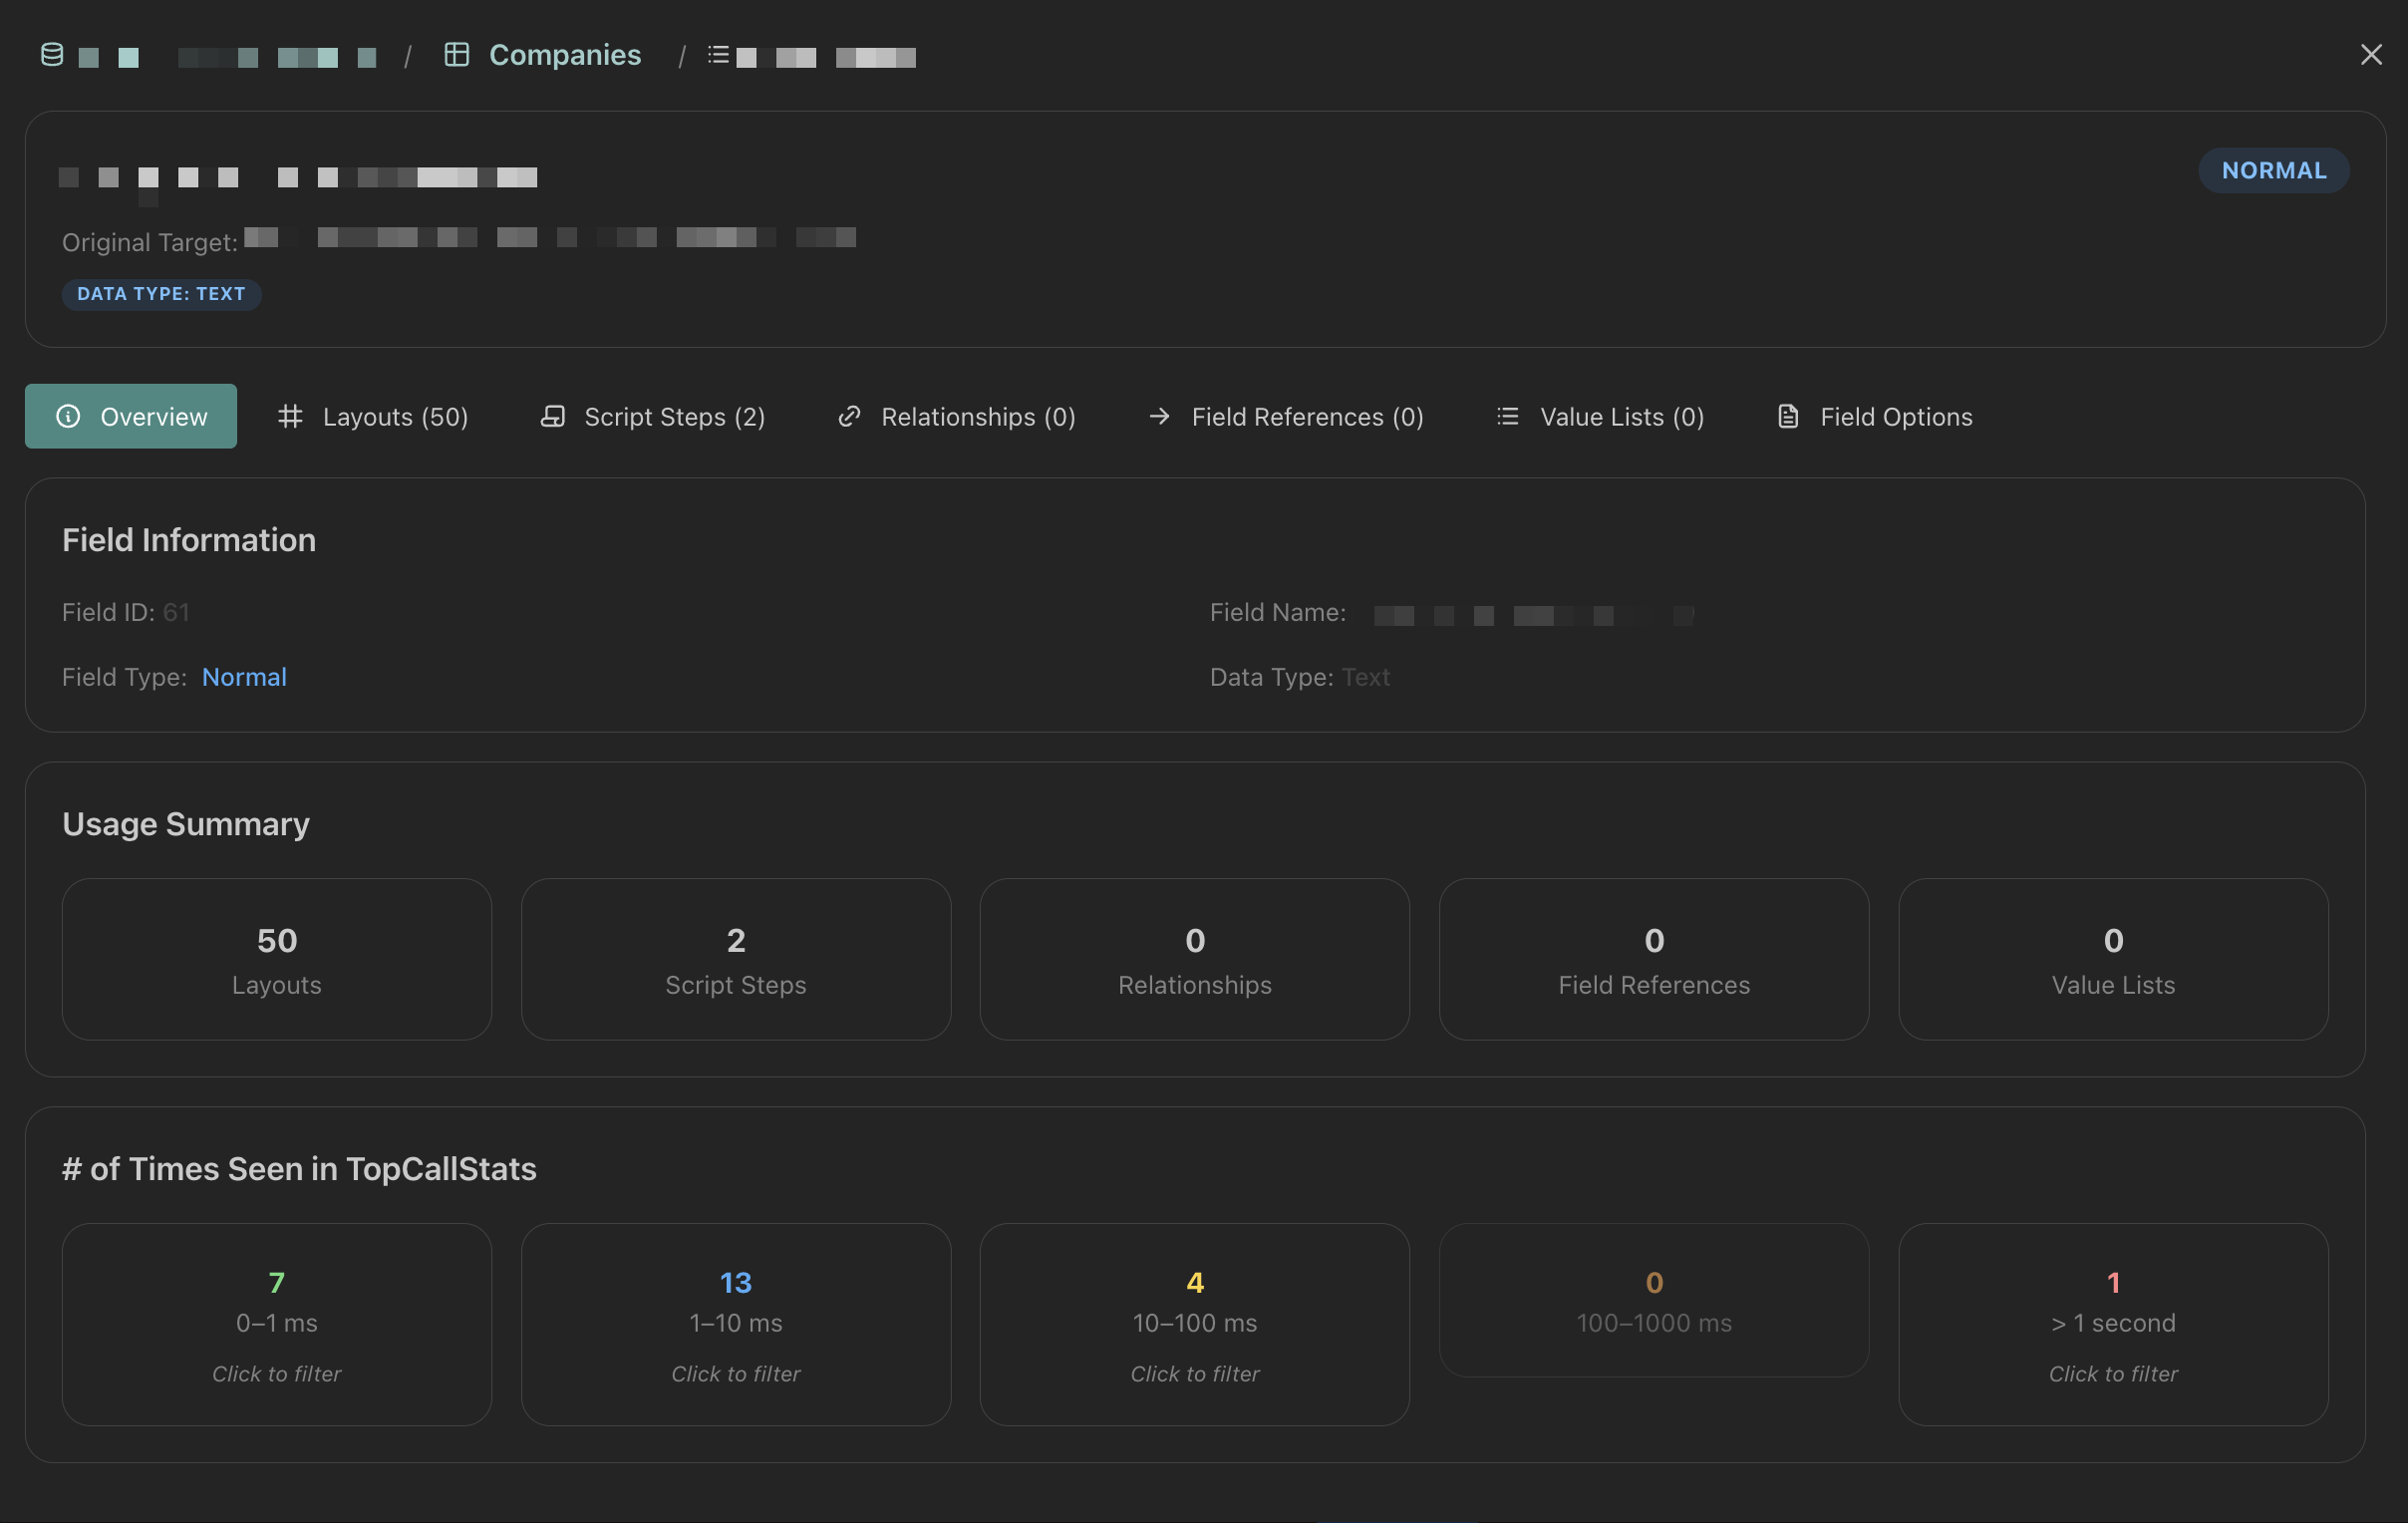
Not only can you analyze and view your TopCallStats info, you can upload (or pull from your server automatically!!) XML files that will allow you to view which fields, tables, layouts, or scripts are the targets of your longest requests. Normally the TopCallStats just prints out IDs, but with our built-in XML parsing, you can easily view what a target actually is without search through your database.
Once you’ve found a target to analyze, click the “Inspect” button to pop open a modal where you can view your file structure, see where a field is used, and explore your file tree quickly and easily.
This feature is still in beta, and we are working on adding more functionality. If you have any requests or suggestions please add them to this thread or in a new post here on the community.
Thanks y’all, and have fun hunting down those performance bugs (I know its probably the most exciting part of your job…)
great stuff @kduval
feeling the potential for an ‘exclude’ filter on the results
for example, and thing from computer (31.185.nnn,nnn) I know is a server side script and I at this moment I don’t care that much about them… It is the ones that are either linked to a user, or to a layout that I want to hone in on,
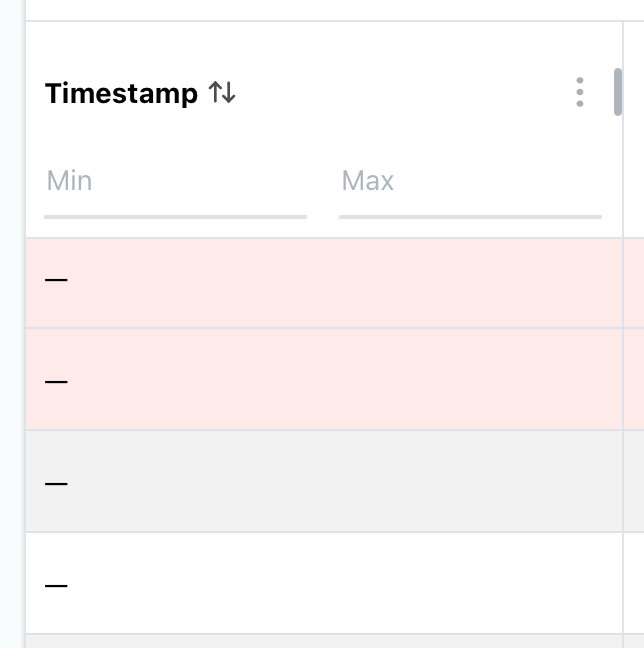
You know, its probably a timestamp formatting thing, we tested primarily with topcallstats from servers in the US. Can you send me the format of the timestamps in your topcallstats and I can take a look.
Absolutely LOVE this. If we could get server resource statistics overlaid on top of the time based Top Calls (and other FM Client Stats) we’d be cooking!
Yes you can! You can upload as many as you want. There is a file size limit of 300-500 MB per XML depending on the browser, which I am planning on removing in the future. But you can add any number of XMLs, which will all be parsed and map the targets.
@flybynight or @john_r would one of y’all mind sending me the topcallstats.log files that is not showing timestamps? I haven’t been able to replicate the timestamp issue.
Thank you @flybynight , after testing with your file, looks like this is a browser issue. Works on chrome and firefox but not on Safari. I’ll run some tests on Safari and get it working, thanks for the help with debugging!
You aren’t required to have your servers hosted on Ottomatic to use the Ottomatic Cloud Console! You can connect those servers to the console and use the tool (or just get the log and xmls yourself from the server and use the tool) with a free Ottomatic Console account.
Thanks, thats great! But I still would love for it to be able to use it in a more high security OnPrem setting. Just if you one day decide to support this.